LZGraphs


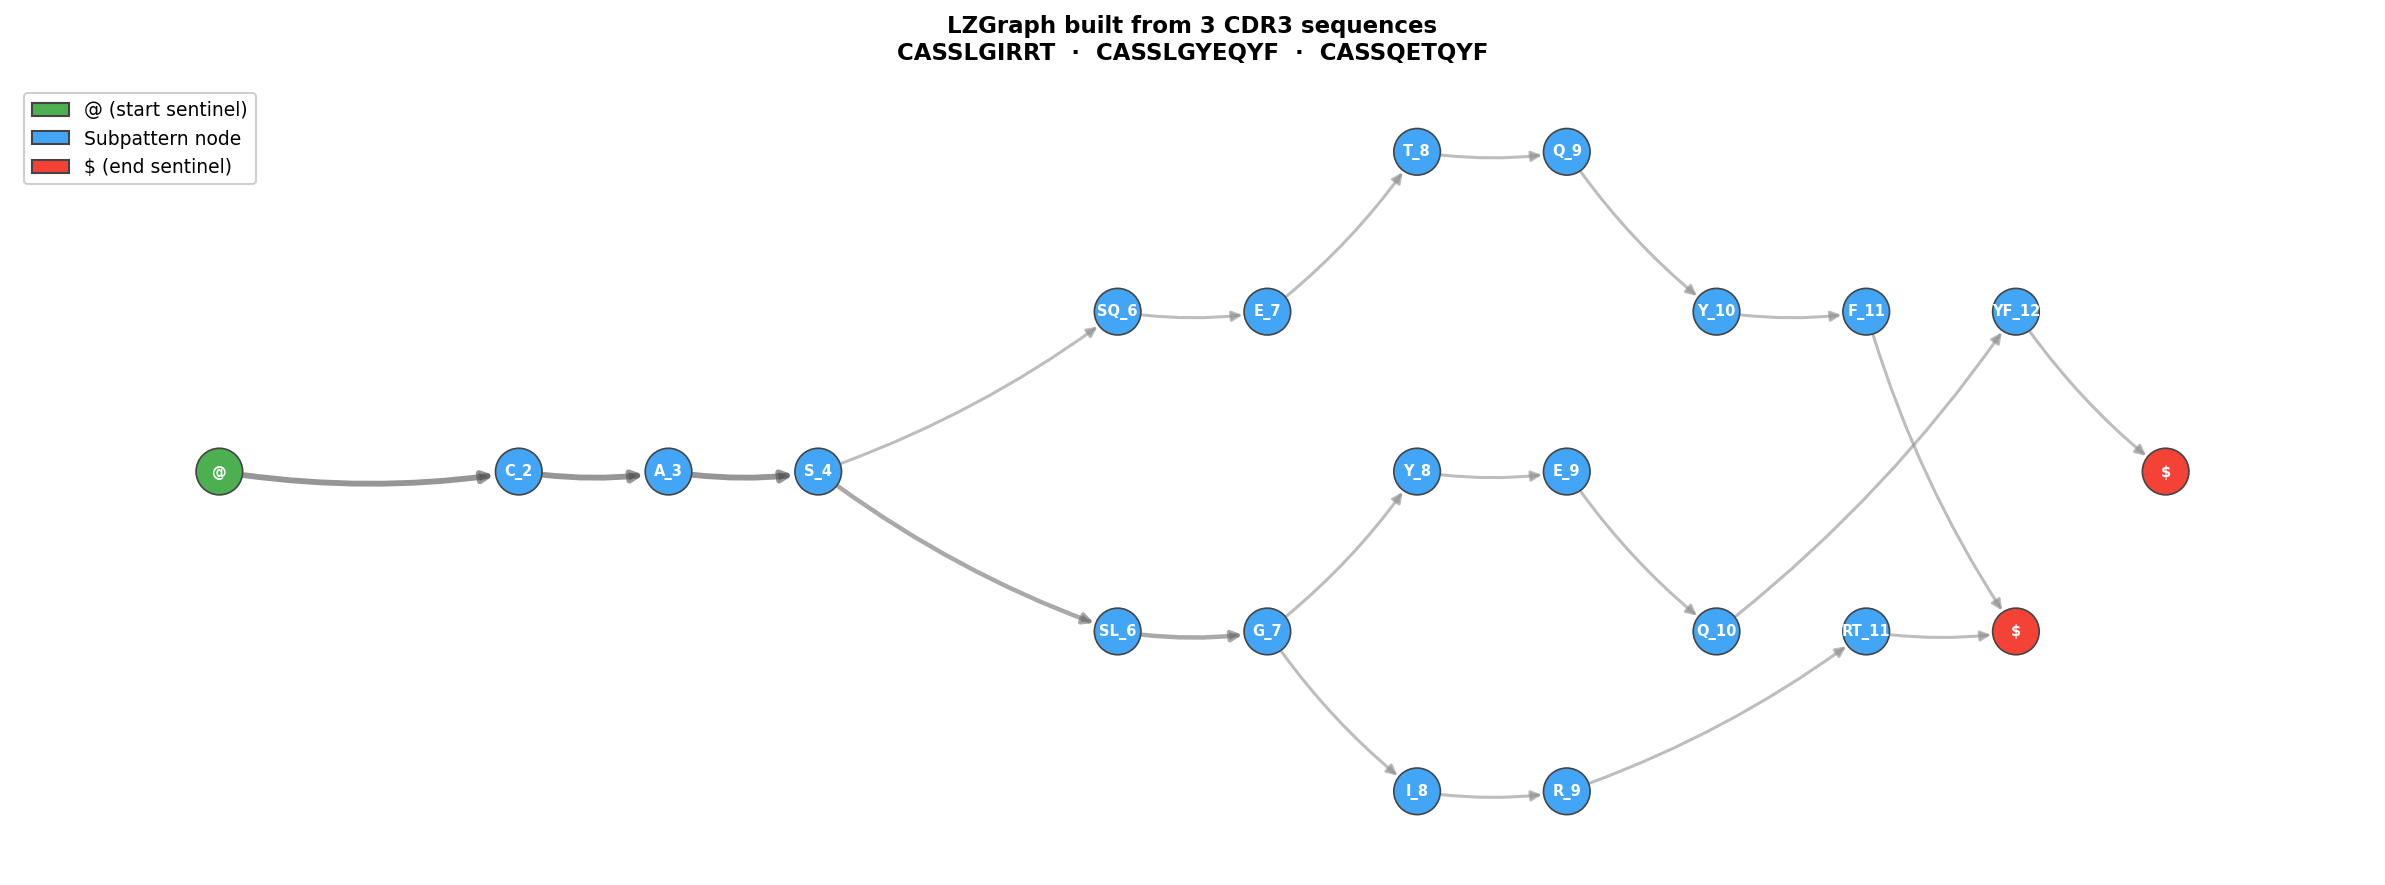
LZGraphs is a high-performance Python library for analyzing immune receptor repertoires using Lempel-Ziv compression graphs. Built on a C core, it transforms CDR3 sequences into directed graphs that support exact probability computation, constrained sequence generation, and analytical diversity measurement, all without alignment or reference genotypes.
LZGraphs provides two complementary graph families:
- LZGraph: A space-efficient dictionary-based graph ideal for large-scale TCR/BCR analysis with V/J gene support.
- FlashBackGraph: A strictly Markovian DAG that enables exact, closed-form diversity metrics and fast sequence scoring.
Quick Start
from LZGraphs import LZGraph, FlashBackGraph

# 1. Standard LZGraph (with V/J gene support)
graph = LZGraph(['CASSLEPSGGTDTQYF', 'CASSDTSGGTDTQYF', 'CASSLEPQTFTDTFFF'],
                variant='aap')

graph.pgen('CASSLEPSGGTDTQYF')          # log generation probability
graph.simulate(1000, seed=42)              # generate new sequences
graph.predicted_richness(100_000)          # richness at sequencing depth

# 2. FlashBackGraph (exact diversity)
fb_graph = FlashBackGraph(['CASSLEPSGGTDTQYF', 'CASSDTSGGTDTQYF'])
fb_graph.hill_number(2)                   # exact inverse Simpson diversity
cal = fb_graph.calibrate_scale(seed=0)    # self-calibrate the SCALE anomaly score
fb_graph.scale_score('CASSLEPSGGTDTQYF', cal)  # SCALE: higher = more anomalous
lzg build repertoire.tsv -o rep.lzg          # build from the command line
lzg diversity rep.lzg                         # diversity report
lzg simulate rep.lzg -n 10000 > synth.txt     # generate sequences
lzg flashback build repertoire.txt -o fb.lzg  # FlashBackGraph commands too
Which graph should I use? Install LZGraph Quickstart FlashBack Quickstart
What LZGraphs does
Score sequences
Compute the exact generation probability of any CDR3 under the repertoire model with pgen(), or flag anomalies with the self-calibrated SCALE score.
Generate sequences
Simulate novel sequences via LZ-constrained or Markovian random walks, with optional V/J gene constraints.
Measure diversity
Hill numbers, Shannon entropy, predicted richness, sample overlap, and sharing spectra, analytically from the graph.
Compare repertoires
Jensen-Shannon divergence, cross-scoring, and graph set operations (union, intersection, difference).
Extract ML features
Project repertoires into fixed-size feature vectors for classification, clustering, and regression.
Personalize models
Bayesian posterior updates to adapt a population graph to an individual patient.
Documentation
Learn Installation, quick start, tutorials, and worked examples.
Guides Task-oriented recipes: data prep, generation, comparison, ML features.
Concepts LZ76 algorithm, probability model, graph variants, distribution analytics.
Reference
Complete API for LZGraph, FlashBackGraph, FlashBackGrammar, PgenDistribution, the CLI tool, and exceptions.
C Performance
Build graphs from 5,000 sequences in 80 ms. Simulate at ~5,000 seqs/sec. Save/load in < 1 ms.
LZ76 Constraints
Every simulated sequence is a valid LZ76 decomposition. No biologically impossible outputs.
If you use LZGraphs in your research, please cite our paper. GitHub · Issues · Contact