

Does my model describe my data?
The question: I built a model from a repertoire. Does it describe that repertoire well, and does it say anything useful about sequences it has not seen?
Check a model the way any model is checked: on data it was not built from. Build it without part of the data, then compare its predictions with what was left out.
What the paper found on real data. A model built without the 768 Emerson donors matched their length and residue composition. Models of naive and memory CD4 and CD8 T cells, each built without one twin family at a time, gave the held-out family’s unseen sequences a higher probability than a model of independent positions in all 40 donor–population comparisons, by 3.66 nats per sequence on average.
The example below shows how to run the same checks on your data. It uses a stand-in repertoire (stand-in population B: CDR3s tilted towards longer lengths); replace it with your own cells.
import numpy as npfrom BEAM import BeamModel# cells: one repertoire's cells. Build on 80% of them; keep 20% aside to check against.train, test = cells[:64_000], cells[64_000:]model = BeamModel(train)AA = "ACDEFGHIKLMNPQRSTVWY"
# 1. Lengths: the model's length distribution against the held-out cells'lengths = np.array([len(s) for s in test])observed = {L: np.mean(lengths == L) for L in set(lengths)}tv_length = 0.5 * sum(abs(model.length_distribution.get(L, 0) - observed.get(L, 0))                      for L in set(observed) | set(model.length_distribution))print(f"length distribution, total variation:   {tv_length:.3f}")
# 2. Composition at each position, for length 15L = 15seqs = [s for s in test if len(s) == L]empirical = np.array([[np.mean([s[i] == a for s in seqs]) for a in AA] for i in range(L)])marginals = model.positional_marginals(L)print(f"positional composition (length {L}), mean total variation: "      f"{0.5 * np.abs(marginals - empirical).sum(axis=1).mean():.3f}")
# 3. Held-out sequences the model never saw: BEAM against a model of independent#    positions with the same length and positional compositionheld_out = sorted(set(test) - set(train))by_length = {L: np.log(model.positional_marginals(L)) for L in {len(s) for s in held_out}}
def independent(s):    m = by_length[len(s)]    return np.log(model.length_distribution[len(s)]) + sum(m[i, AA.index(a)] for i, a in enumerate(s))
beam = model.log_pseq_batch(held_out)indep = np.array([independent(s) for s in held_out])print(f"{len(held_out):,} unseen held-out sequences: BEAM scores them {np.mean(beam - indep):.2f} nats higher on average" f" ({np.mean(beam > indep):.0%} of them)")length distribution, total variation: 0.012positional composition (length 15), mean total variation: 0.05215,800 unseen held-out sequences: BEAM scores them 5.93 nats higher on average (96% of them)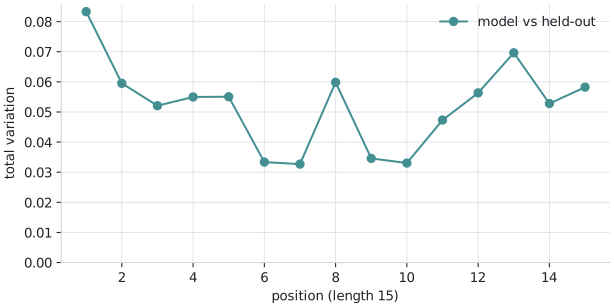
Reading the three checks
Section titled “Reading the three checks”- Lengths. The total variation between the model’s length distribution and the held-out cells’ is the share of probability that would have to move to make them equal. Values near 0 mean the model has the repertoire’s lengths right.
- Composition at each position. The same measure for the residues at each position of one length. Part of what remains is sampling noise in the held-out cells themselves: a few thousand sequences of one length do not estimate twenty residue frequencies per position exactly.
- Unseen sequences. The real test of a sequence model is what it says about sequences it never saw. A model of independent positions, built from the same length and positional composition, is the natural baseline: it knows which residues are common where, but not which residues go together. A model that captures which neighbouring residues occur together should give the held-out sequences a higher probability than that baseline, as BEAM did on the paper’s real data.