

How deeply should I sequence?
The question: if I sample n cells, how many different sequences should I expect to see, and how much would sequencing deeper add?
Because common sequences are drawn again and again, a sample of n cells contains fewer than n distinct sequences, and each additional cell is less likely to bring something new. BEAM computes the expected number of distinct sequences for any depth directly from the model of the population, summing over every possible sequence rather than simulating samples.
Explore sequencing depth
Drag the slider to change the number of cells sampled. Teal: expected distinct sequences in the sample. Orange: how many of them a second, independent sample of the same depth would also contain. The dashed line is the ceiling where every cell carries a new sequence. Every value is computed from the reference model, without simulation.
Distinct sequences at a given depth
Section titled “Distinct sequences at a given depth”ExactOccupancy holds a model and answers sampling questions about it. richness(n) is the
expected number of distinct sequences among n cells.
import BEAMfrom BEAM.analytics.exact_occupancy import ExactOccupancy
model = BEAM.load_pretrained("human_tcrb_cdr3_aa_foundation")occupancy = ExactOccupancy(model)
print(" cells sampled distinct sequences distinct share error bound")for depth in [1e3, 1e4, 1e5, 1e6, 1e7, 1e8, 1e9]: r = occupancy.richness(depth) print(f"{depth:16,.0f} {r.value:19,.0f} {r.value / depth:15.1%} {r.bound:12.2g}") cells sampled distinct sequences distinct share error bound 1,000 999 99.9% 7e-13 10,000 9,943 99.4% 4.4e-13 100,000 96,771 96.8% 2.9e-13 1,000,000 879,776 88.0% 2e-13 10,000,000 7,232,134 72.3% 1.5e-13 100,000,000 54,108,121 54.1% 1.3e-13 1,000,000,000 376,652,048 37.7% 1.2e-13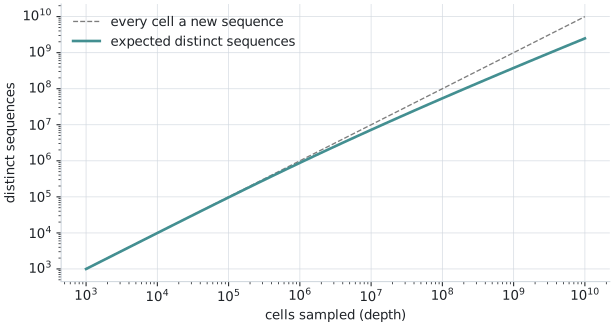
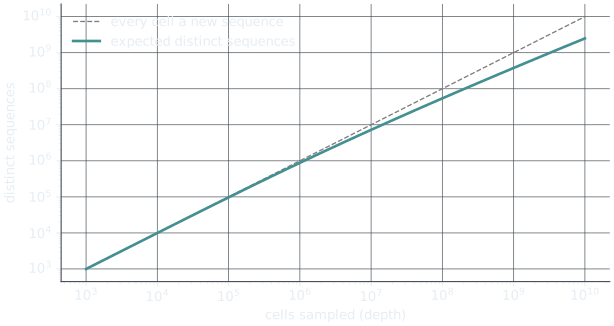
In a sample of 100,000 cells, 96.8% of the cells carry a sequence not seen earlier in the sample. At ten million, more than a quarter of the cells repeat a sequence already drawn, and at a billion almost two thirds do. The curve never flattens completely: the population has far more sequences than any sample can hold.
Each answer carries its bound, a guaranteed limit on the relative error (here around
). The first richness call on a large model takes a minute or two while the
integrals it needs are prepared; after that every depth is answered almost instantly.
How much does the count vary?
Section titled “How much does the count vary?”richness(n) is the expected number of distinct sequences; the count in one sample varies
around it. richness_sd(n) gives the standard deviation of that count, computed in the same way
as the expectation, without simulation (richness_variance(n) gives its square).
import BEAMfrom BEAM.analytics.exact_occupancy import ExactOccupancy
model = BEAM.load_pretrained("human_tcrb_cdr3_aa_foundation")occupancy = ExactOccupancy(model)
print(" cells sampled expected distinct standard deviation as share of expected")for depth in [10_000, 100_000, 1_000_000, 10_000_000]: mean = occupancy.richness(depth) sd = occupancy.richness_sd(depth) # computed, like the mean: no simulation print(f"{depth:16,} {mean.value:18,.0f} {sd.value:19,.1f} {sd.value / mean.value:21.3%}") cells sampled expected distinct standard deviation as share of expected 10,000 9,943 8.0 0.081% 100,000 96,771 60.5 0.063% 1,000,000 879,776 341.9 0.039% 10,000,000 7,232,134 1,403.8 0.019%The spread is small: 8 sequences at 10,000 cells, 60 at 100,000 and about 1,400 at ten million, under a tenth of a percent of the count at every depth. Two samples of the same depth from one population therefore differ by little through chance alone, typically by about 1.4 standard deviations. A count further than two standard deviations from the expected one is more than chance under this model: the sample does not behave like independent draws from it, for example because of clonal expansion, or it comes from a different population.
The first call on a large model takes a few minutes, like the first richness call; later calls
at other depths reuse what it prepared.
What would sequencing deeper add?
Section titled “What would sequencing deeper add?”richness_difference(n2, n1) gives the new distinct sequences gained going from n1 to n2
cells, computed directly rather than as the difference of two large numbers.
import BEAMfrom BEAM.analytics.exact_occupancy import ExactOccupancy
model = BEAM.load_pretrained("human_tcrb_cdr3_aa_foundation")occupancy = ExactOccupancy(model)
print(" from depth to depth new distinct sequences share of the extra cells")for depth in [1e5, 1e6, 1e7, 1e8]: gained = occupancy.richness_difference(2 * depth, depth) print(f"{depth:13,.0f} {2 * depth:10,.0f} {gained.value:23,.0f} {gained.value / depth:24.1%}") from depth to depth new distinct sequences share of the extra cells 100,000 200,000 93,093 93.1% 1,000,000 2,000,000 797,106 79.7% 10,000,000 20,000,000 6,142,082 61.4% 100,000,000 200,000,000 43,566,144 43.6%Doubling 100,000 cells to 200,000 still adds 93,093 new sequences: 93% of the extra cells bring something new. Doubling 100 million cells adds new sequences with only 44% of the extra cells. This is the diminishing return to plan a sequencing budget with.
Seen once, twice or more: the occupancy spectrum
Section titled “Seen once, twice or more: the occupancy spectrum”frequency(n, j) is the expected number of sequences seen exactly j times in a sample of n
cells. Over these make up the sample’s occupancy spectrum: how its
distinct sequences divide into those seen once, twice and more often.
import BEAMfrom BEAM.analytics.exact_occupancy import ExactOccupancy
model = BEAM.load_pretrained("human_tcrb_cdr3_aa_foundation")occupancy = ExactOccupancy(model)
depth = 1_000_000print(f"in {depth:,} cells, expected number of sequences seen exactly j times:")for j in [1, 2, 3, 4, 5, 10]: print(f" j = {j:2} {occupancy.frequency(depth, j).value:12,.0f}")in 1,000,000 cells, expected number of sequences seen exactly j times: j = 1 824,740 j = 2 34,488 j = 3 9,593 j = 4 4,112 j = 5 2,161 j = 10 297The occupancy spectrum at any depth
Loading…
Drag the slider to change the number of cells sampled. Each bar is the expected number of sequences seen exactly that many times in the sample; the orange bar collects those seen more than 20 times. Switch to the share of cells to see how the cells divide among the classes. Every value is computed from the reference model.
At a million cells, 93.7% of the distinct sequences are seen exactly once, and the 306 seen more than 20 times carry 1.2% of the cells. At a billion cells, 83% are still seen once, while 4.1 million sequences seen more than 20 times carry 44% of the cells: the common sequences of the population take a growing share of a deeper sample.
Comparing a sample with the spectrum
Section titled “Comparing a sample with the spectrum”The expected spectrum is what the population alone produces at a given depth, with every cell an
independent draw from it. Count how many sequences of a sample were seen exactly times and
set the counts beside frequency(n, j) at the sample’s depth: a sample with expanded clones
has many more sequences seen many times than the population produces.
from collections import Counterimport numpy as npimport BEAMfrom BEAM.analytics.exact_occupancy import ExactOccupancy
# ordinary, expanded: two samples of 100,000 cells (lists of sequences, one per cell)model = BEAM.load_pretrained("human_tcrb_cdr3_aa_foundation")occupancy = ExactOccupancy(model)n = 100_000
def spectrum(cells):                  # how many sequences were seen exactly j times    return Counter(Counter(cells).values())
seen = {"ordinary": spectrum(ordinary), "expanded": spectrum(expanded)}print(" times seen expected ordinary sample expanded sample")for j in [1, 2, 3, 5, 10]: print(f"{j:10} {occupancy.frequency(n, j).value:9,.0f} {seen['ordinary'][j]:16,}" f" {seen['expanded'][j]:16,}")over = lambda s: sum(c for j, c in s.items() if j > 10)expected_over = occupancy.richness(n).value - sum(occupancy.frequency(n, j).value for j in range(1, 11))print(f"{'> 10':>10} {expected_over:9,.0f} {over(seen['ordinary']):16,} {over(seen['expanded']):16,}") times seen expected ordinary sample expanded sample 1 94,570 94,559 35,976 2 1,714 1,727 8,262 3 306 317 3,126 5 38 35 870 10 2 3 147 > 10 12 12 807An ordinary sample of 100,000 cells from the reference population follows the expected spectrum closely: 94,559 sequences seen once against 94,570 expected, and 12 seen more than ten times, as expected. A donor with expanded clones departs from it at once: 35,976 sequences seen once, and 807 seen more than ten times where the population alone produces 12. The excess at the high end is the expanded clones, and how far the spectrum departs shows how strongly the repertoire is expanded.
For how much of the population’s diversity a sample of a given depth shows, and the chance that the next cell sequenced is new, see How diverse is my sample?.