

How diverse is my sample, really?
The question: I measured the diversity of my sample. How much of the population’s diversity does that number reflect, and have I sequenced enough?
Diversity indices computed from a sample, such as Shannon entropy, are biased: a finite sample misses the rare sequences, so it looks less diverse than the population it came from. BEAM computes the population’s diversity directly from its model, over every possible sequence, and how much of it a sample of a given depth is expected to show.
The diversity of the population
Section titled “The diversity of the population”entropy is the Shannon entropy of the model’s sequence distribution, computed over every
sequence. Its exponential, , is the effective number of sequences: the number of equally
common sequences that would be as diverse. hill_number(2.0) is the inverse Simpson index,
, which weighs common sequences more.
import mathimport BEAM
model = BEAM.load_pretrained("human_tcrb_cdr3_aa_foundation")
H = model.entropy() # Shannon entropy of the sequence distribution, natsprint(f"entropy H: {H:.3f} nats")print(f"effective number of sequences: D1 = exp(H) = {math.exp(H):.3e}")print(f"inverse Simpson (Hill order 2): D2 = {model.hill_number(2.0):.3e}")entropy H: 19.426 natseffective number of sequences: D1 = exp(H) = 2.733e+08inverse Simpson (Hill order 2): D2 = 6.291e+05The population behind the reference model is as diverse as about 270 million equally common sequences by Shannon entropy, and about 630 thousand by the inverse Simpson index, which counts the common sequences most.
How much diversity a sample shows
Section titled “How much diversity a sample shows”sampling_deficit_many(depths) gives the entropy a sample of each depth is expected to lose
to finite sampling. The sample’s expected Shannon entropy is the population’s minus that
deficit. novelty_many(depths) gives the chance that the next cell sequenced carries a sequence
not yet in the sample.
import mathimport BEAMfrom BEAM.analytics.exact_occupancy import ExactOccupancy
model = BEAM.load_pretrained("human_tcrb_cdr3_aa_foundation")occupancy = ExactOccupancy(model)H = model.entropy()
depths = [1e4, 1e5, 1e6, 1e7, 1e8, 1e9, 1e10]deficit = occupancy.sampling_deficit_many(depths)     # entropy lost to finite samplingnovelty = occupancy.novelty_many(depths)              # chance the next cell is a new sequence
print(" cells sampled sample entropy share of H chance next cell is new")for n, s, u in zip(depths, deficit, novelty): print(f"{n:16,.0f} {H - s.value:10.3f} nats {(H - s.value) / H:10.1%} {u.value:22.1%}") cells sampled sample entropy share of H chance next cell is new 10,000 9.202 nats 47.4% 99.0% 100,000 11.458 nats 59.0% 94.6% 1,000,000 13.564 nats 69.8% 82.5% 10,000,000 15.354 nats 79.0% 64.6% 100,000,000 16.733 nats 86.1% 46.4% 1,000,000,000 17.713 nats 91.2% 31.3% 10,000,000,000 18.371 nats 94.6% 20.2%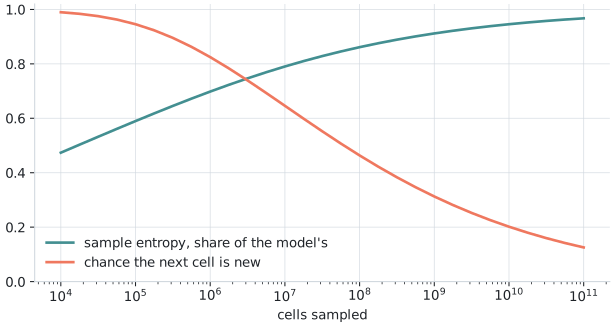
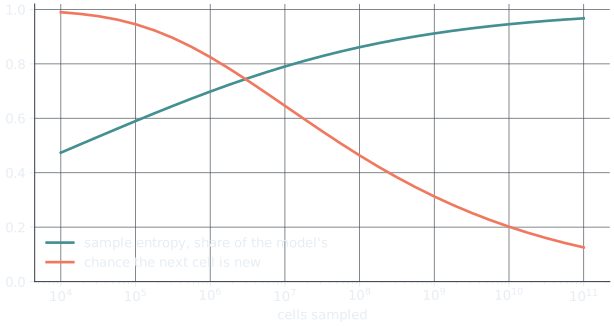
A sample of 100,000 cells shows only 59% of the population’s Shannon entropy; even ten billion cells show 95%. The chance that the next cell is new falls slowly as well: after a million cells, the next cell still has an 82.5% chance of carrying a sequence not yet seen. The rare sequences, each individually improbable, make up the missing part.
Use this to:
- correct a measured diversity for depth: the expected sample entropy at your depth is the baseline to compare a measured entropy against;
- compare samples of different depths fairly: compare each with its own expected value;
- decide whether to sequence more: the chance of a new sequence says how much more sequencing would still reveal.
The depth slider shows both quantities at any depth up to cells.
Comparing diversity between repertoires
Section titled “Comparing diversity between repertoires”To compare the diversity of repertoires sequenced to different depths, bring them to a common
depth first. depth_matched_hill_profiles resamples each repertoire to the smallest depth in the
set, builds a model from each resample and returns its Hill numbers; see
Diversity at equal depth.