How public is a sequence?
The question: in a cohort of people, how many would I expect to carry this sequence in their sampled repertoire?
A sequence is public when it appears in many people. How many depends on two things: how
common the sequence is in the population, which is its probability under the model, and how
deeply each person was sampled. PublicnessModel combines them: the mean and variance in
closed form, and the full distribution by an accurate numerical inversion.
Expected carriers
Section titled “Expected carriers”Describe the cohort by the depth of each person’s sample, then ask about a sequence’s probability.
import mathimport BEAMfrom BEAM import PublicnessModel
model = BEAM.load_pretrained("human_tcrb_cdr3_aa_foundation")cohort = PublicnessModel([50_000] * 100)      # 100 people, 50,000 cells sampled from each
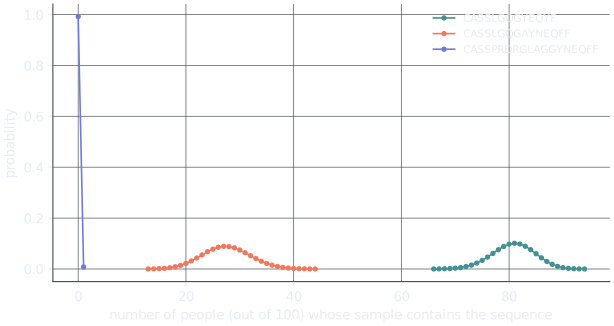
for cdr3 in ["CASSLGQGYEQYF", "CASSLGQGAYNEQFF", "CASSPRDRGLAGGYNEQFF"]: mean, variance = cohort.moments(model.pseq(cdr3)) print(f"{cdr3:20} expected carriers {mean:6.2f} ± {math.sqrt(variance):.2f}")CASSLGQGYEQYF expected carriers 80.75 ± 3.94CASSLGQGAYNEQFF expected carriers 27.51 ± 4.47CASSPRDRGLAGGYNEQFF expected carriers 0.01 ± 0.09moments returns the mean and variance of the number of carriers. The most common of the three
sequences is expected in about 81 of the 100 people; the rarest in almost nobody.
The whole distribution
Section titled “The whole distribution”The mean is not the whole story: pmf gives the probability that exactly 0, 1, 2, … people carry
the sequence.
import numpy as npimport BEAMfrom BEAM import PublicnessModel
model = BEAM.load_pretrained("human_tcrb_cdr3_aa_foundation")cohort = PublicnessModel([50_000] * 100)
pmf = cohort.pmf(model.pseq("CASSLGQGAYNEQFF")) # P(exactly k carriers), k = 0..100print(f"P(nobody carries it) {pmf[0]:.3f}")print(f"P(1 to 5 people) {pmf[1:6].sum():.3f}")print(f"P(more than 5 people) {pmf[6:].sum():.3f}")print(f"most likely: {np.argmax(pmf)} people")P(nobody carries it) 0.000P(1 to 5 people) 0.000P(more than 5 people) 1.000most likely: 27 people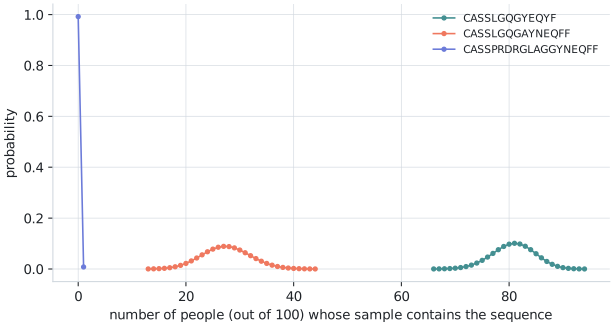
Explore publicness
Loading…
Choose a cohort size, a sampling depth and a sequence, or set any sequence probability with the slider. The bars show the probability that each number of people carries the sequence, computed from the reference model.
Cohorts sampled to different depths
Section titled “Cohorts sampled to different depths”Real cohorts mix shallow and deep samples. Give each person’s depth:
import BEAMfrom BEAM import PublicnessModel
model = BEAM.load_pretrained("human_tcrb_cdr3_aa_foundation")
# 20 people sampled to 10,000 cells, 50 to 100,000 and 30 to 1,000,000depths = [10_000] * 20 + [100_000] * 50 + [1_000_000] * 30cohort = PublicnessModel(depths)
mean, variance = cohort.moments(model.pseq("CASSLGQGAYNEQFF"))print(f"{cohort.n_repertoires} people, expected carriers {mean:.1f}")100 people, expected carriers 54.9To stay fast, people of similar depth are grouped into at most 64 groups, each represented by
one depth. With 64 or fewer distinct depths, as here, nothing is grouped. With more, the result
is a close approximation; cohort.depth_spread gives the widest ratio of depths within a group
(1.0 means no grouping), and PublicnessModel(depths, depth_bins=len(set(depths))) avoids
grouping altogether.
The most public sequences of a repertoire
Section titled “The most public sequences of a repertoire”moments takes many probabilities at once, so a whole repertoire can be ranked by how public
its sequences are expected to be:
import numpy as npimport BEAMfrom BEAM import PublicnessModel
model = BEAM.load_pretrained("human_tcrb_cdr3_aa_foundation")# repertoire: the distinct CDR3s of one samplecohort = PublicnessModel([100_000] * 100)
probabilities = np.exp(model.log_pseq_batch(repertoire))expected, _ = cohort.moments(probabilities)          # one call for the whole list
order = np.argsort(expected)[::-1]print("most public sequences of this sample (expected carriers out of 100):")for i in order[:5]: print(f" {repertoire[i]:18} {expected[i]:5.1f}")print(f"expected in fewer than one person: {np.mean(expected < 1):.0%} of its sequences")most public sequences of this sample (expected carriers out of 100): CASSPQRNTEAFF 100.0 CASSQSPGGTQYF 100.0 CASSQSPGGIQYF 100.0 CASSALLGSASTQYF 100.0 CASSLVPEAYNEQFF 100.0expected in fewer than one person: 71% of its sequencesAt this depth the most common sequences are expected in all 100 people, while 71% of this sample’s sequences are expected in fewer than one person: most of any repertoire is private. The sequences at the top are the ones a cohort study would see again and again.
The publicness of a whole cohort
Section titled “The publicness of a whole cohort”Instead of one sequence at a time, ask about every sequence at once: how many sequences are
expected to be carried by exactly 1, 2, …, all of the people in a cohort. This is the cohort’s
publicness spectrum. BEAM computes it over every sequence the model can produce, grouped onto
a fine grid of probabilities (pseq_analysis().atoms). The example’s grid of 16,384 values
agrees with the grid-free counts of distinct and private sequences to within 3 × 10⁻⁵; a grid of
4,096 values needs about a third of the memory and stays within about 1.5%.
import numpy as npimport BEAMfrom BEAM import PublicnessModelfrom BEAM.analytics.exact_occupancy import ExactOccupancy
BEAM.set_memory_budget(32 << 30)       # a fine probability grid needs about 20 GBmodel = BEAM.load_pretrained("human_tcrb_cdr3_aa_foundation")
# Every sequence the model can produce, grouped onto a fine grid of probabilitiesp, w = model.pseq_analysis().atoms(16384).as_arrays()cohort = PublicnessModel([100_000] * 100)             # 100 people, 100,000 cells each
counts = cohort.expected_counts(p, w)["expected_counts"]   # [k]: sequences in exactly k peopleseen = counts[1:].sum()print(f"distinct sequences in the cohort: {seen:,.0f}")print(f"private (in one person):          {counts[1]:,.0f}  ({counts[1] / seen:.1%})")for k in (2, 5, 10, 50, 100):    print(f"in exactly {k:3} people:            {counts[k]:,.1f}")
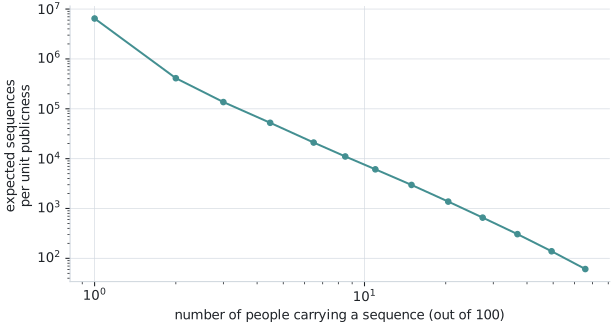
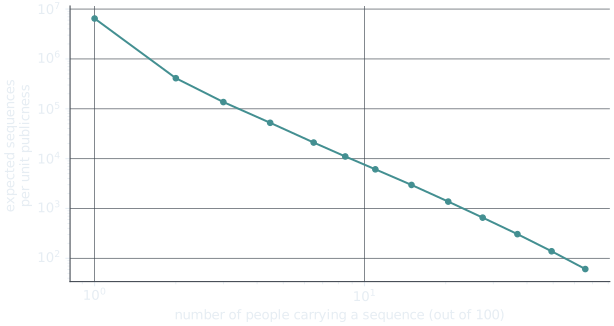
# The grid is an approximation; check it against the grid-free calculationdirect = ExactOccupancy(model).equal_depth_cohort(100_000, 100)print(f"grid-free: {direct['seen'].value:,.0f} distinct, {direct['private'].value:,.0f} private " f"(grid within {abs(seen / direct['seen'].value - 1):.1e} and " f"{abs(counts[1] / direct['private'].value - 1):.1e})")distinct sequences in the cohort: 7,232,357private (in one person): 6,463,037 (89.4%)in exactly 2 people: 410,436.8in exactly 5 people: 38,443.4in exactly 10 people: 7,463.3in exactly 50 people: 130.5in exactly 100 people: 38.6grid-free: 7,232,134 distinct, 6,462,810 private (grid within 3.1e-05 and 3.5e-05)Of the 7.2 million distinct sequences expected across 100 people, 89% are private to one person, and the counts fall steadily with publicness, approximately as a power law, as in the paper’s predicted spectra. About 39 sequences are expected in all 100 people: common enough that almost everyone carries them, they collect at that boundary, so the plots below leave the top bin out, as the paper’s figure does.
The publicness spectrum
Loading…
Choose a cohort size and a sampling depth. Each dot is the expected number of sequences carried by that many people, averaged over log-spaced bins of publicness as in the paper's figure; the top bin, where sequences in nearly everyone collect, is left out. Larger cohorts extend the spectrum to higher publicness; deeper sampling raises it at every level.
How private is each donor?
Section titled “How private is each donor?”In a cohort of unequal depths, each person’s expected share of private sequences differs: a
deeply sampled donor has more rare sequences that nobody else has. private_at_depth gives each
donor’s expected distinct and private counts:
import numpy as npimport BEAMfrom BEAM.analytics.exact_occupancy import ExactOccupancy
model = BEAM.load_pretrained("human_tcrb_cdr3_aa_foundation")occupancy = ExactOccupancy(model)
depths = np.logspace(4, 6, 10)            # ten donors, 10,000 to 1,000,000 cellsresult = occupancy.private_at_depth(depths, total_depth=depths.sum())
print(" cells distinct private to this donor")for d, n, priv in zip(depths, result["distinct"], result["private"]): print(f"{d:9,.0f} {n.value:9,.0f} {priv.value / n.value:8.1%}") cells distinct private to this donor 10,000 9,943 76.2% 16,681 16,538 76.5% 27,826 27,471 76.8% 46,416 45,548 77.3% 77,426 75,333 78.0% 129,155 124,204 79.0% 215,443 204,015 80.4% 359,381 333,676 82.3% 599,484 543,171 84.8%1,000,000 879,776 88.2%The shallowest donors are expected to have about 76% private sequences and the deepest about 88%: deeper samples reach further into the rare sequences that nobody else carries.
This is the baseline the paper compared real donors with: observed private fractions varied between donors more than sampling from one shared distribution produces, so something beyond sampling, biological or technical, differs between them.
What public sequences look like
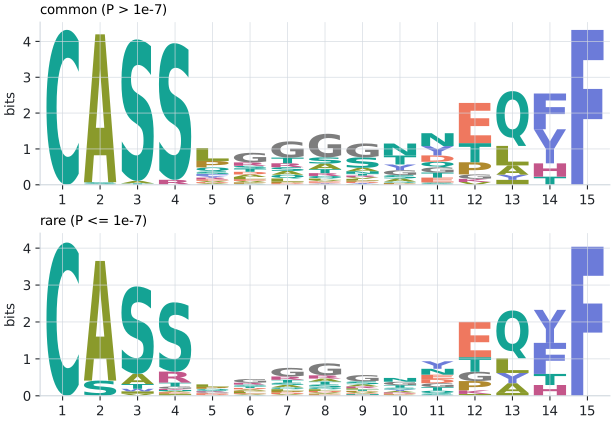
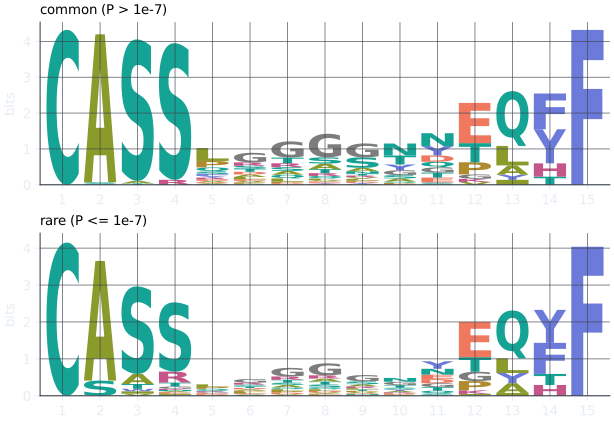
Section titled “What public sequences look like”Sequence logos of the common and the rare sequences of one length show what probable, and therefore public, sequences look like: common sequences are more constrained. (The paper’s logos, split by expected publicness rather than probability, show the constraint arising first at the start of the CDR3 and then through the junction.)
import BEAM
BEAM.set_memory_budget(16 << 30)          # these logos need about 6 GBmodel = BEAM.load_pretrained("human_tcrb_cdr3_aa_foundation")
common = model.insights.logo(15, pseq_above=1e-7) # length-15 sequences with P > 1e-7rare = model.insights.logo(15, pseq_below=1e-7) # and the restprint(f"common: {common.fraction:.1%} of the probability at length 15, consensus {common.consensus_sequence}")print(f"rare: {rare.fraction:.1%} of the probability at length 15, consensus {rare.consensus_sequence}")print(f"information, common vs rare: {common.information_bits.sum():.1f} vs {rare.information_bits.sum():.1f} bits")common: 25.1% of the probability at length 15, consensus CASSLGGGGNNEQFFrare: 74.9% of the probability at length 15, consensus CASSLGGGGNYEQYFinformation, common vs rare: 37.0 vs 29.4 bitsAt length 15, the common sequences carry a quarter of the probability and 37 bits of information, against 29 bits for the rare ones: common sequences are more predictable at almost every position.